• Main Menu &
Navigation
• Graph Display
Panel
• Node &
Edge Data
• Uploading
Data
Graph Display Options
contains two main
sections, which can be opened by selecting the corresponding tab:
1. Edge Filter – provides a
brief description and some useful links about a particular gene in the
graph.
2. Node Attribute –
select
node
attributes
to
be highlighted on the graph.
Edge Filter (TOP)

The
Edge Filter Panel provides a
menu of the different
functional edge types available. This menu is constructed automatically
from stored data types
and/or data uploaded by the user
(see " Uploading Data").
Mouse-over data descriptions
Mousing over each menu item (i.e. edge type or dataset) will
cause detailed information for that item to be displayed.
Changing edge colors
Each edge type defaults to a color chosen by the
system. Colors can be easily changed by the user by clicking on one of
the colored boxes on the left of the menu and selecting a new color
from the palette.
Filtering by number of edges
Users can choose to display all links between nodes or only
those links that are supported by multiple independent pieces of
evidence. This is controlled by the "Multi-Edge Only" checkbox at the
top of the Edge Filter Panel. If
selected, then it shows only multiply supported links.
Selecting this option hides from view all links between nodes that are
only supported by a single piece of evidence. The remaining
"multi-support" links may be supported by two or more different
edge types (e.g. protein interaction and genetic interaction)
AND/OR by edges from two or more datasets of the same type .
If unselected, then show
all edges for selected types and datasets(normal).
Users can also choose to display only links between the query
nodes. This is controlled by the "Spoke View Only" checkbox at
the top of the Edge Filter Panel. If selected, then it shows only
the nodes and edges connected to the query nodes. If unselected,
then all interactions between nodes are displayed.
Users can also select both "Multi-Edge Only" and Spoke View Only"
checkboxes to view multiply connected links between nodes that are only
connected to the query nodes.
Selecting
datasets and numerical thresholds
By default, all data types and data sets available are
included for display. This can result in a very large number of edges
being included in the display. Users can limit the edges displayed
using check boxes for different data types and datasets, and by
changing the numerical cutoffs (where present). The Edge Filter allows one to toggle the
display of edges between hidden and visible.
Edge size
Clicking
on
the
button
with
"..."
on
the right of the datasets brings up a
window that allows one to choose Small, Medium, or Large for the size
of edges for that dataset.
Collapsing
Clicking on the double arrows expands/collapses the
display of the datasets for a type.
Node Attribute (TOP)
Paints selected attributes on nodes in the current graph. Any node
"attributes", such as phenotypes, sequence conservation, protein
domains, etc. available can be painted on the network graph in the Graph Display Panel. Like
the Edge Filter,
the
Node Attribute menu is
auto-generated from data in the N-Browse database.
Selecting Attributes for Display
When the Node Attribute tab is opened, a list of
available attributes will be displayed (for example, phenotypes,
protein domains, etc.). Select a checkbox to load the corresponding
attribute class for highlighting on the graph.
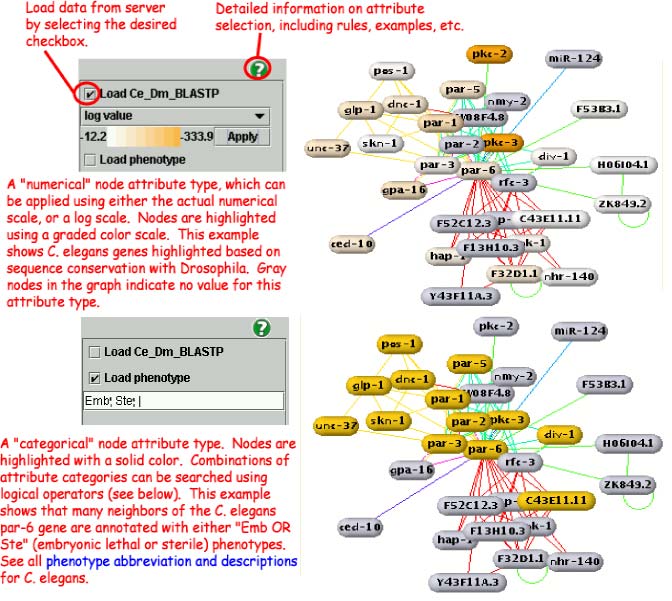
Node attributes may be highlighted with either a graded scale of color
intensity (for numerical data) or a solid color (for categorical data).
Type 1: Color Scale (Rainbow)
Attributes with a numerical range may be displayed with
either a regular numerical scale or a log scale. All nodes in the
current graph with a numerical value for this attribute type will be
painted according to the color scale. Nodes with no value will become
gray.
Example: BLAST e-values between two species, such as
"Ce_Dm BLAST e-value" available for C. elegans.
Type 2: Category and Range Value
Search the graph by category.
Example: Phenotypes with penetrance values,
available for C. elegans. "Emb" will select genes
with embryonic lethality.
Logical Operations
The collection of nodes in the current graph can be searched for
attributes individually, or in combinations of two or more using the
logical operators AND ("&") and OR ("|"). (Note: the OR operator
has higher precedence than the AND operator).
The current combinatorial search function allows only a limited range
of combinations but will be expanded in future versions.
Examples:
Term1 =>
Highlight genes in the current graph whose attributes contain Term1.
Term1; Term2;& => Highlight
genes in the current graph whose attributes contain "Term1 AND Term2".
Term1; Term2; | =>
Highlight genes in the current graph whose attributes contain "Term1 OR
Term2".
Term1; Term2; Term3; & =>
Highlight genes in the current graph whose attributes contain "Term1,
Term2, AND Term3".
Term1; Term2; &; Term3; | =>
Highlight genes in the current graph whose attributes contain "(Term1
AND Term2) OR Term3".