| RNAi Experiment: TH:343A12 |
Ace View of TH:343A12
|
| Genes Inhibited |
 |
| Gene Inhibited |
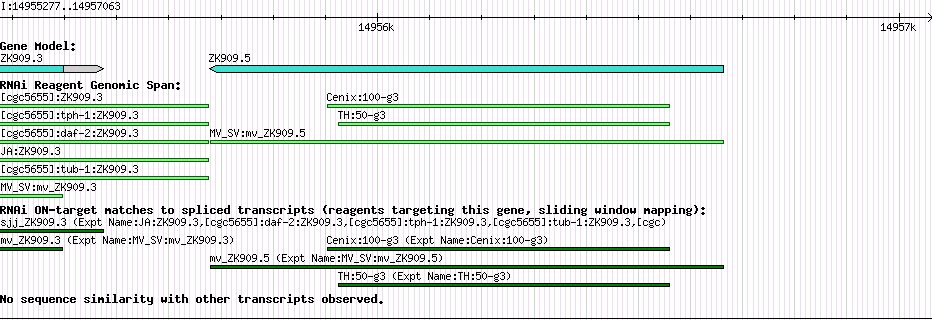
ZK909.5 |
| Evidence for Inhibition |
| ePCR |
Status: Unique_ePCR (I:14955925..14956559)
Transcript overlap: 635 nt |
|
|
| External "ZK909.5" Links |
  |
| Gene Inhibited |
F10E9.8 (sas-4) |
| Description of "F10E9.8" |
sas-4 encodes a predicted coiled-coil protein and centriole component recruited to the centrosome once per cell cycle at the time of organelle duplication and is required for centriole duplication and spindle assembly, levels dictate centrosome size, and also affects germ cell proliferation and locomotion; colocalizes with gamma-tubulin to centrosomes both in sperm and in the syncitial part of the gonad. |
| Evidence for Inhibition |
| Sliding Window |
Raw score: 1186
Relative score: 1 (This gene has the best score for this RNAi reagent)
Specificity index: 1 (RNAi reagent is specific for this gene) |
| Wormbase (BLAST) |
RNAi primary |
|
| External "F10E9.8" Links |
|
| TH:343A12 Phenotypes |
|
|
| Embryonic |
Emb Penetrance None reported |
| TH:343A12 Experiment Details |
Ace View |
| Laboratory |
TH |
| RNAi Reagent & Type |
TH:343A12 (PCR_reagent) |
| Remark |
Phenotype comment -- Confirmed with independent dsRNA (F10E9.8-RNA2); not confirmed with third dsRNA (F10E9.8-RNA3). |
| Reference |
Gonczy P et al. (2000) Nature "Functional genomic analysis of cell division in C. elegans using RNAi of genes on ...." |
| Date |
2000-11-16 |
| Gene Plot of F10E9.8 |
Browse using GBrowse
|
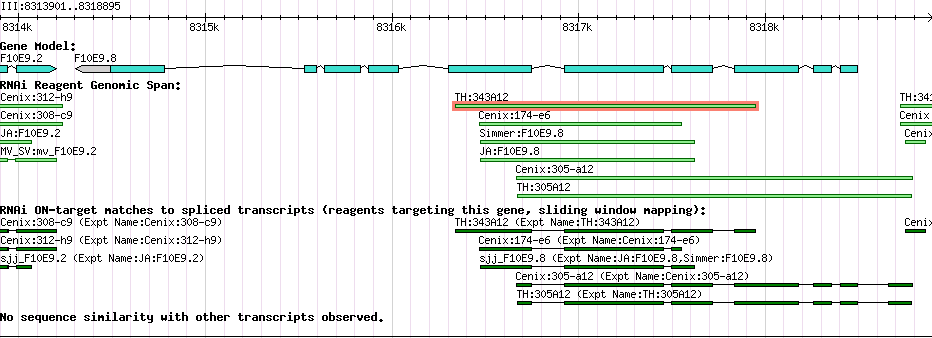 |
| Gene Plot of ZK909.5 |
Browse using GBrowse
|
 |

)


