• Main Menu &
Navigation
• Graph Display Panel
• Graph
Display Options
• Uploading Data
Node & Edge Data
contains two main
sections, which can be opened by selecting the corresponding tab:
1. Node Info –
provides a
brief description and some useful links about a particular gene in the
graph.
2. Edge Info –
provides gene interaction information information, along with dataset
information.
3. GO Term –
Displays the Gene Ontology DAG (directed acyclic graph) and highlights
terms for gene(s) in the current graph.
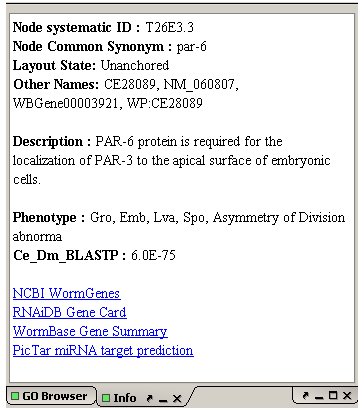
Node Info (TOP)
Displays a variety of information about the current node (gene),
including the anchored/unanchored state for layout calculations.
It is selected in
the Graph Display Panel by
mouse-over.
Information
for genes may include systematic and common names,
description, GO terms, phenotypes, etc. Links to useful external sites
are also provided for each species. Node info is triggered by mousing
over nodes.
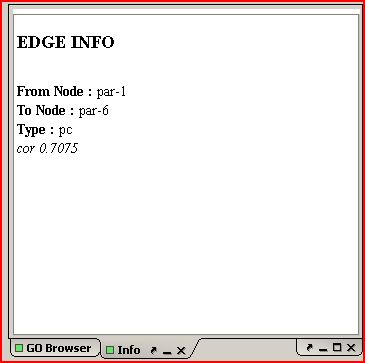
Edge Info (TOP)
Displays a variety of information about the current edge (gene
interaction). The edge itself is selected in
the Graph Display Panel by
mouse-over.
Left
clicking on the edge will display the edge information.
Information for gene interactions may include common names for
interacting genes, interaction type, datasets, and dataset cutoff
values.
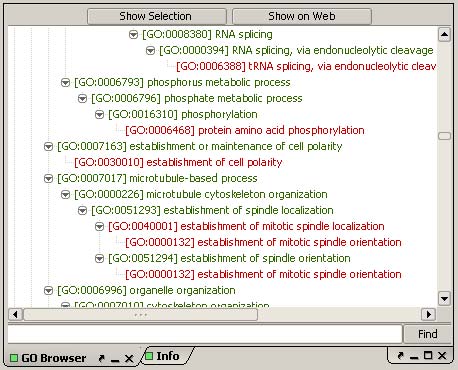
GO Term (TOP)
Displays the GO "tree", or DAG. Clicking on a specific GO term in this
panel will highlight any nodes in the graph that are annotated with
that term. Clicking "Show Selection" all GO terms
associated with the selected set of genes will then be highlighted in
the DAG. Selecting "Show on Web" will open a web window that displays
the GO terms associated with those genes in a graphical
hierarchy(QuickGO).